For analysts
See how the run moves from dataset preparation to EDA, model comparison, diagnostics, SHAP, and generated reports.
This public example gives you a quick look at a finished Titanic survival classification run in Xalec AutoML Services. It shows the kind of detail a run should preserve: dataset shape, readiness checks, model comparison, selected-model metrics, explainability, model-review context, report excerpts, diagnostics, and saved outputs.
This Titanic example shows the kind of trail Xalec AutoML Services should preserve after a run: the data that went in, the checks that happened before training, the model comparison, the selected-model evidence, the review context, and the reports or files someone can inspect later.
See how the run moves from dataset preparation to EDA, model comparison, diagnostics, SHAP, and generated reports.
Review the selected model, selection metrics, class-balance caution, saved plots, and model-review context before using the output.
Open the manifest when you want the machine-readable evidence excerpt behind this completed run.
Open manifest →This page follows the order a user would naturally check: what data went in, what target was modeled, what predictors were used, and what outputs were saved.
The prepared dataset had 1,309 rows, split into 1,047 training records and 262 test records.
The modeled outcome was passenger survival, using the saved target column survived.
The raw predictors were pclass, sex, age, sibsp, parch, and fare, expanded into 12 encoded features for modeling.
The run preserved the machine-readable manifest, reports, plots, model files, preprocessing files, prediction outputs, diagnostics, logs, and metadata.
Before training, the platform checks whether the data is ready to model. The EDA step confirms the target, requested predictors, plot generation, missingness, class balance, and basic feature quality before the run moves into model comparison.
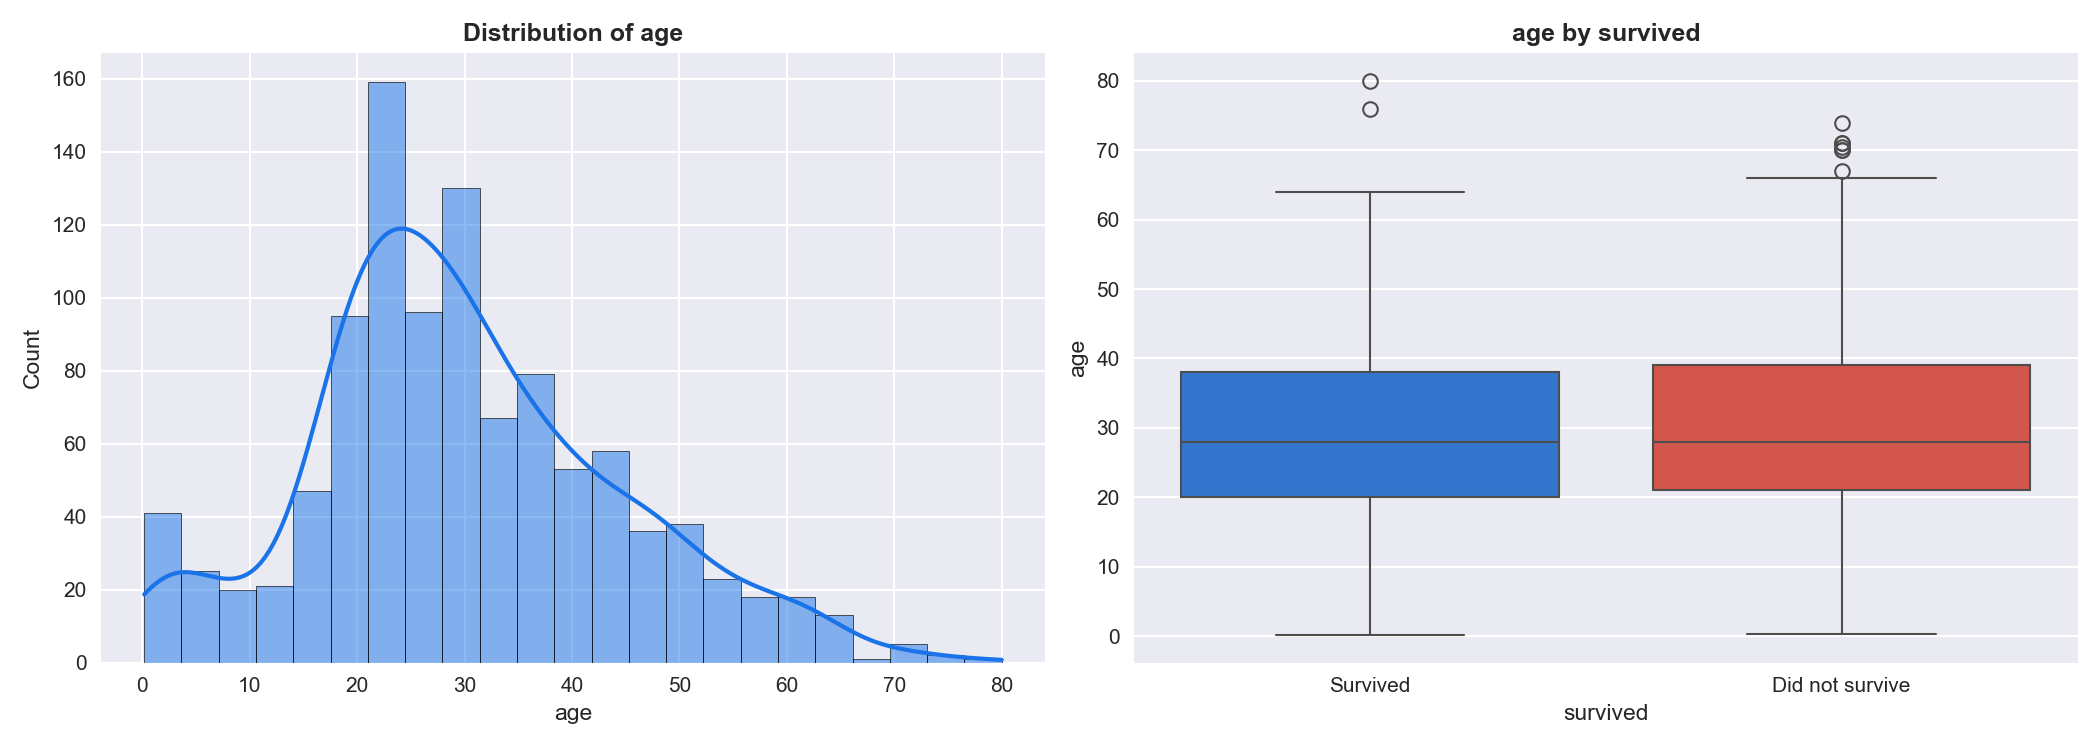
EDA passed. The report found the target column, requested features, numeric and categorical fields, plots, and statistics.
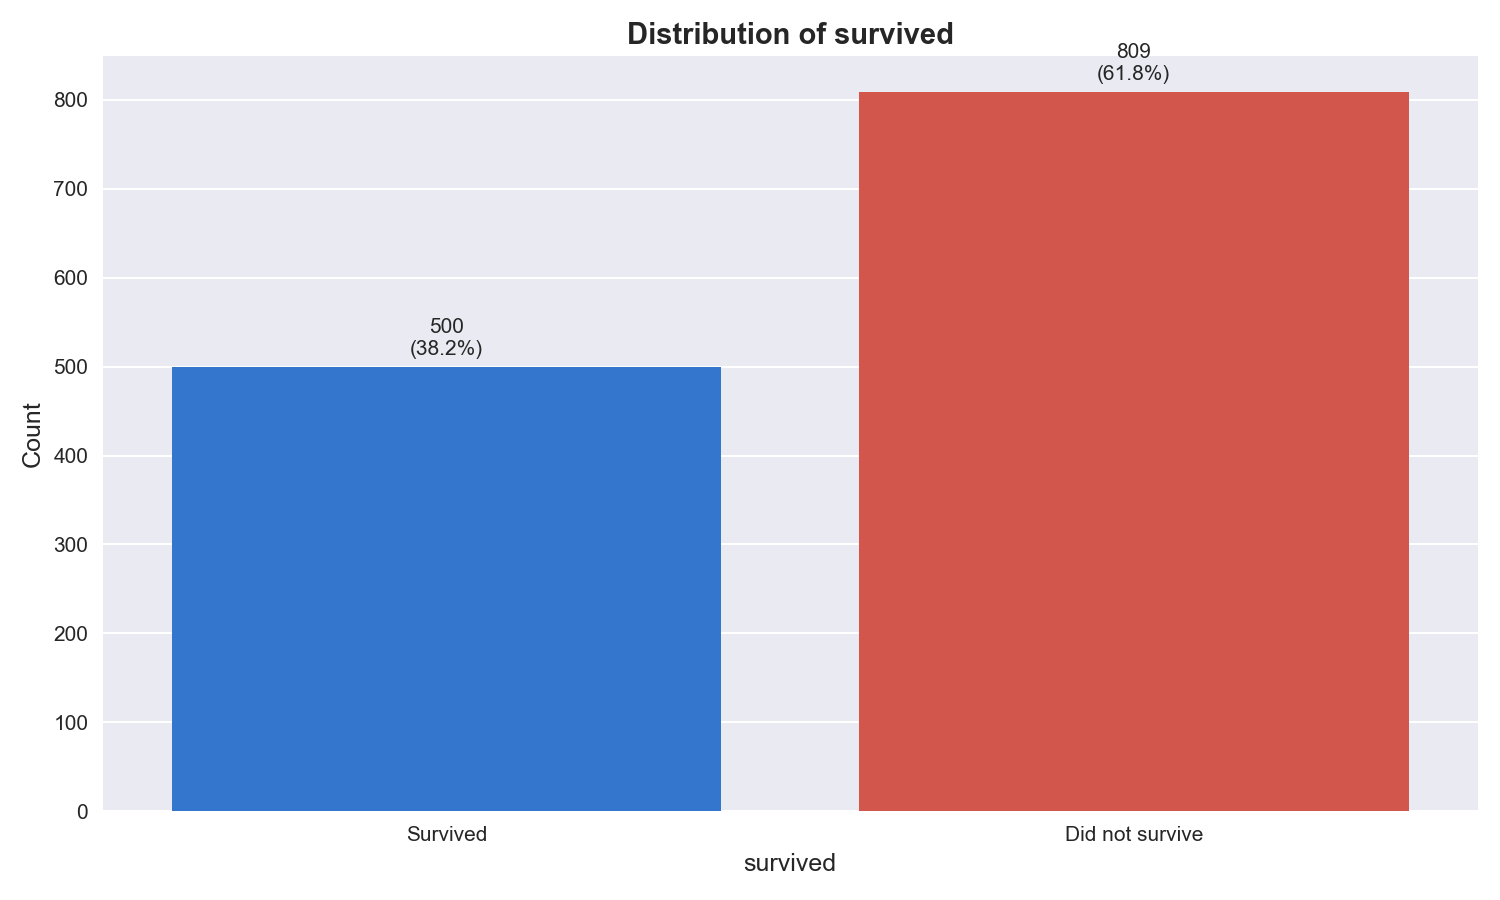
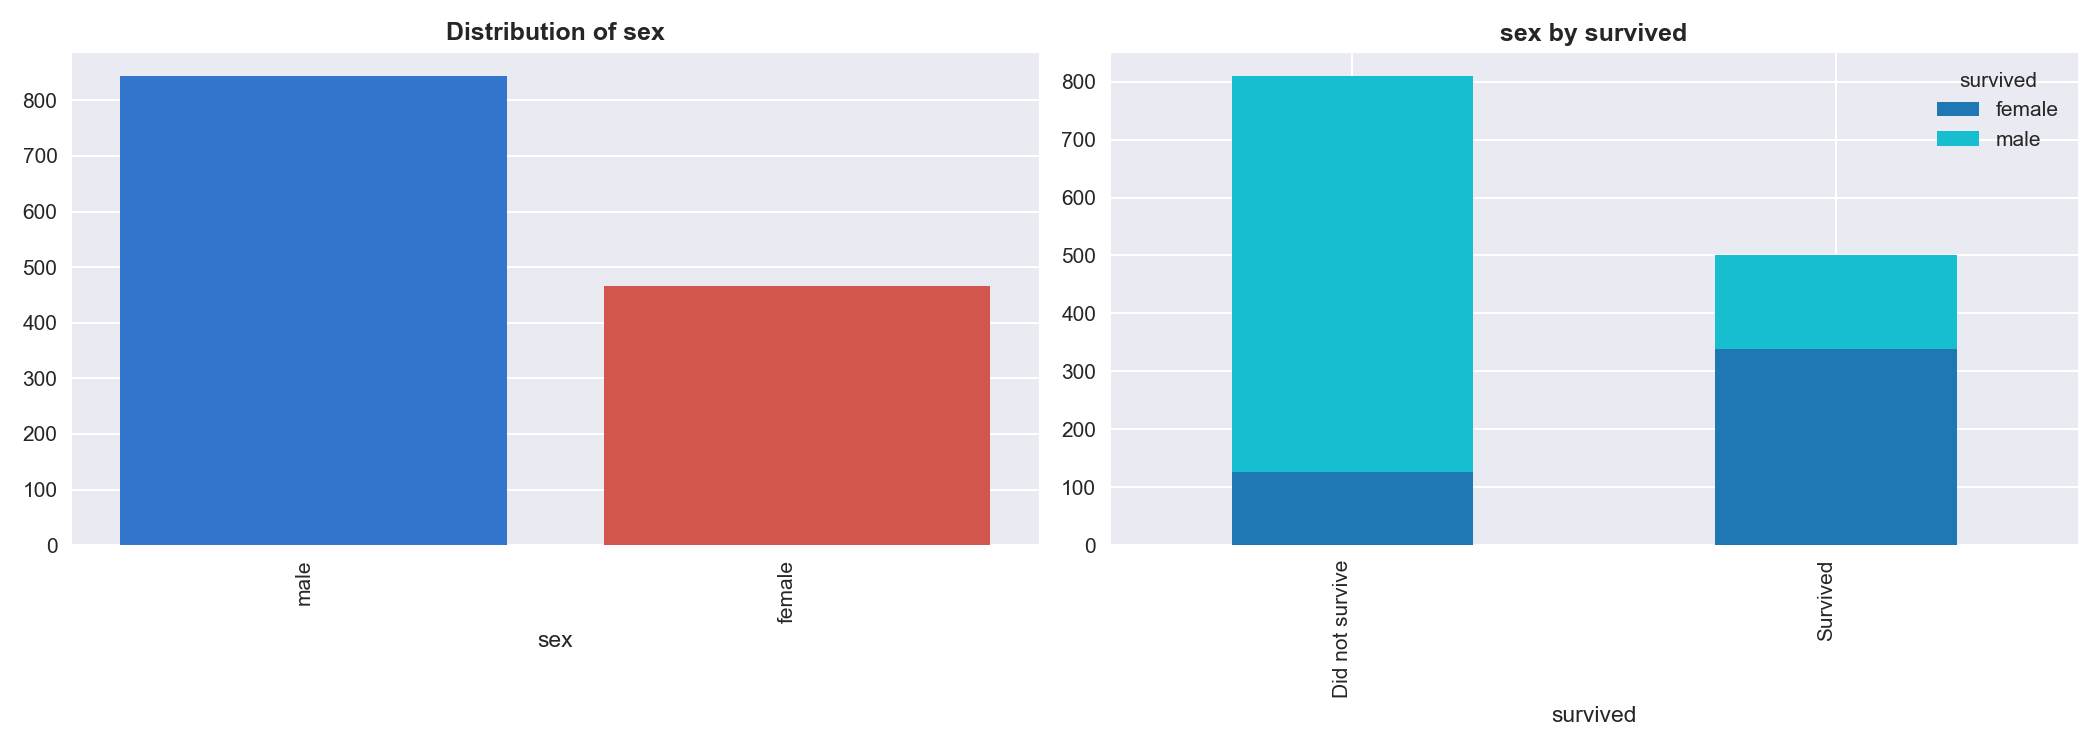
809 passengers did not survive and 500 survived, giving a 61.8% / 38.2% split.
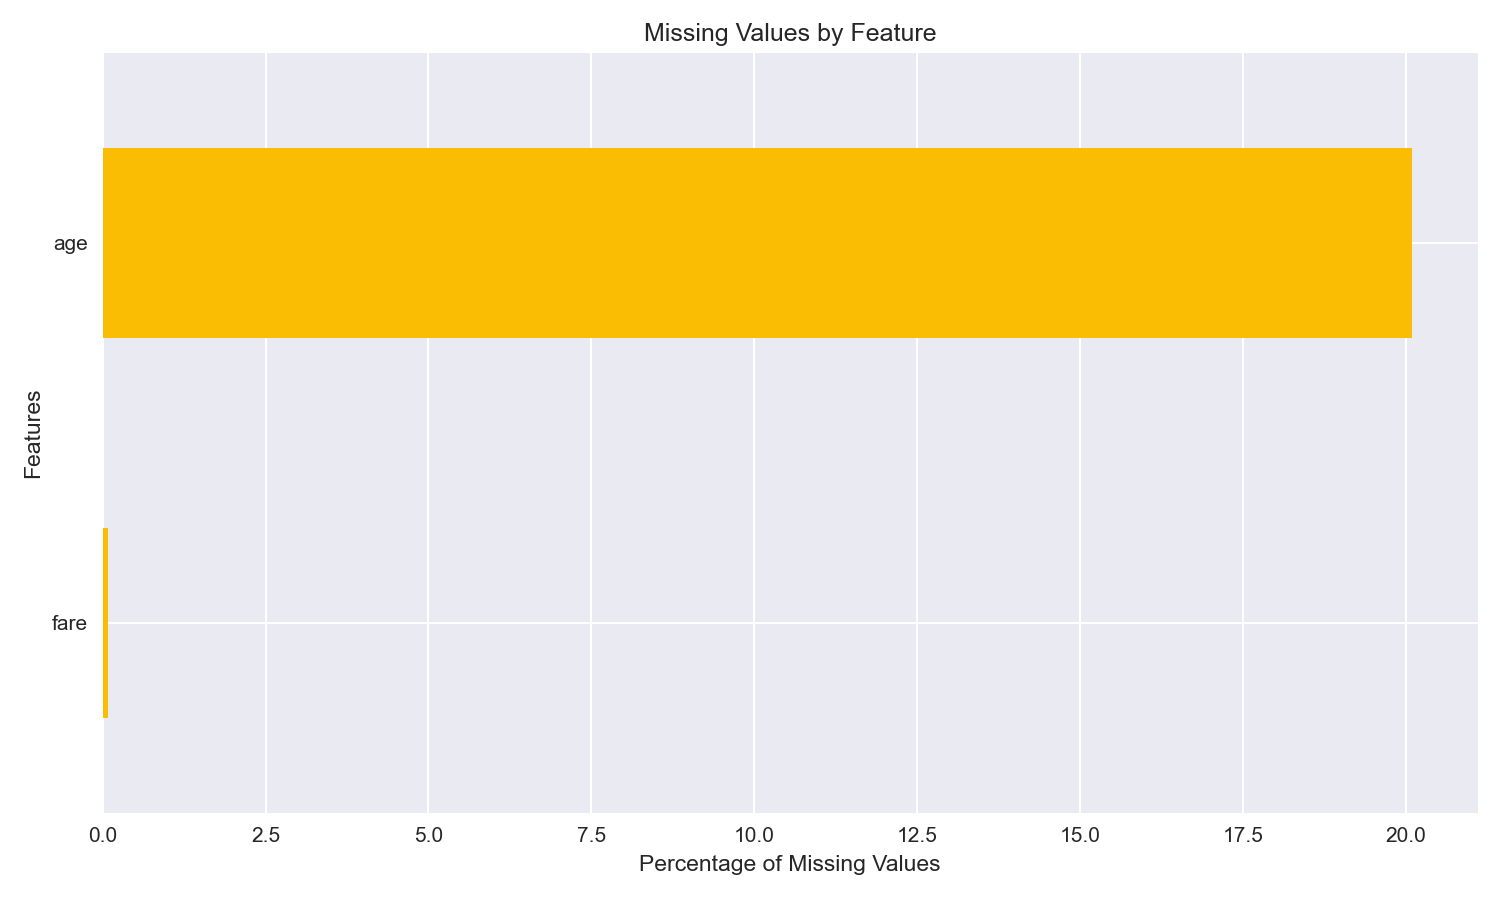
Overall missing fraction was 2.88%, visible in the saved missing-values diagnostic.
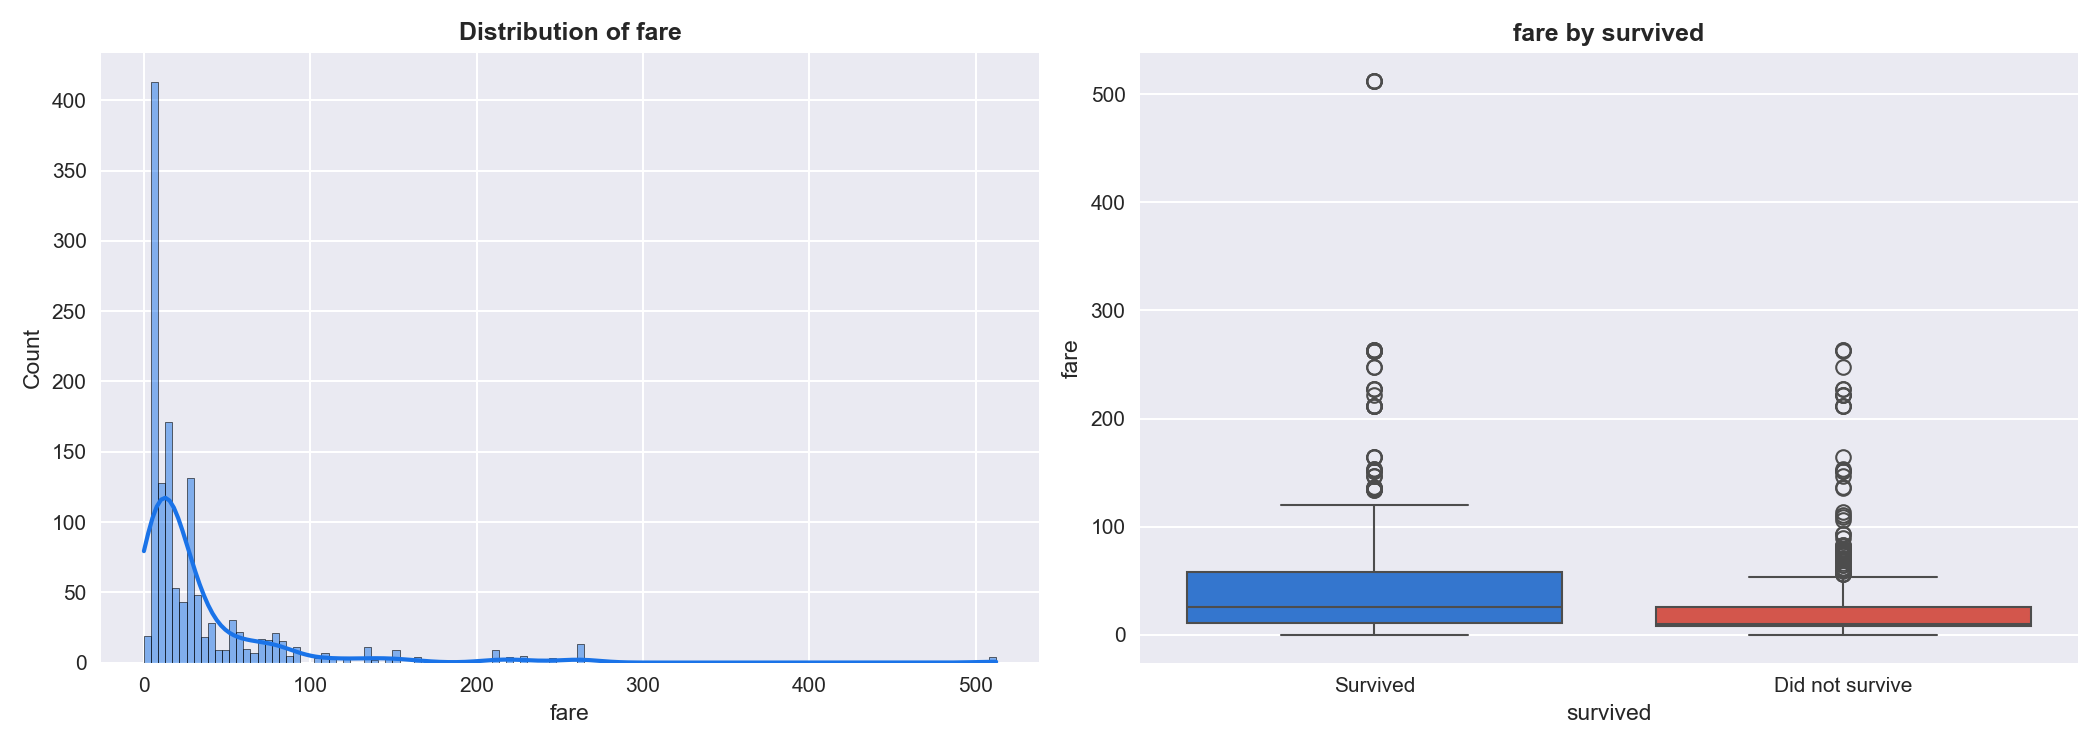
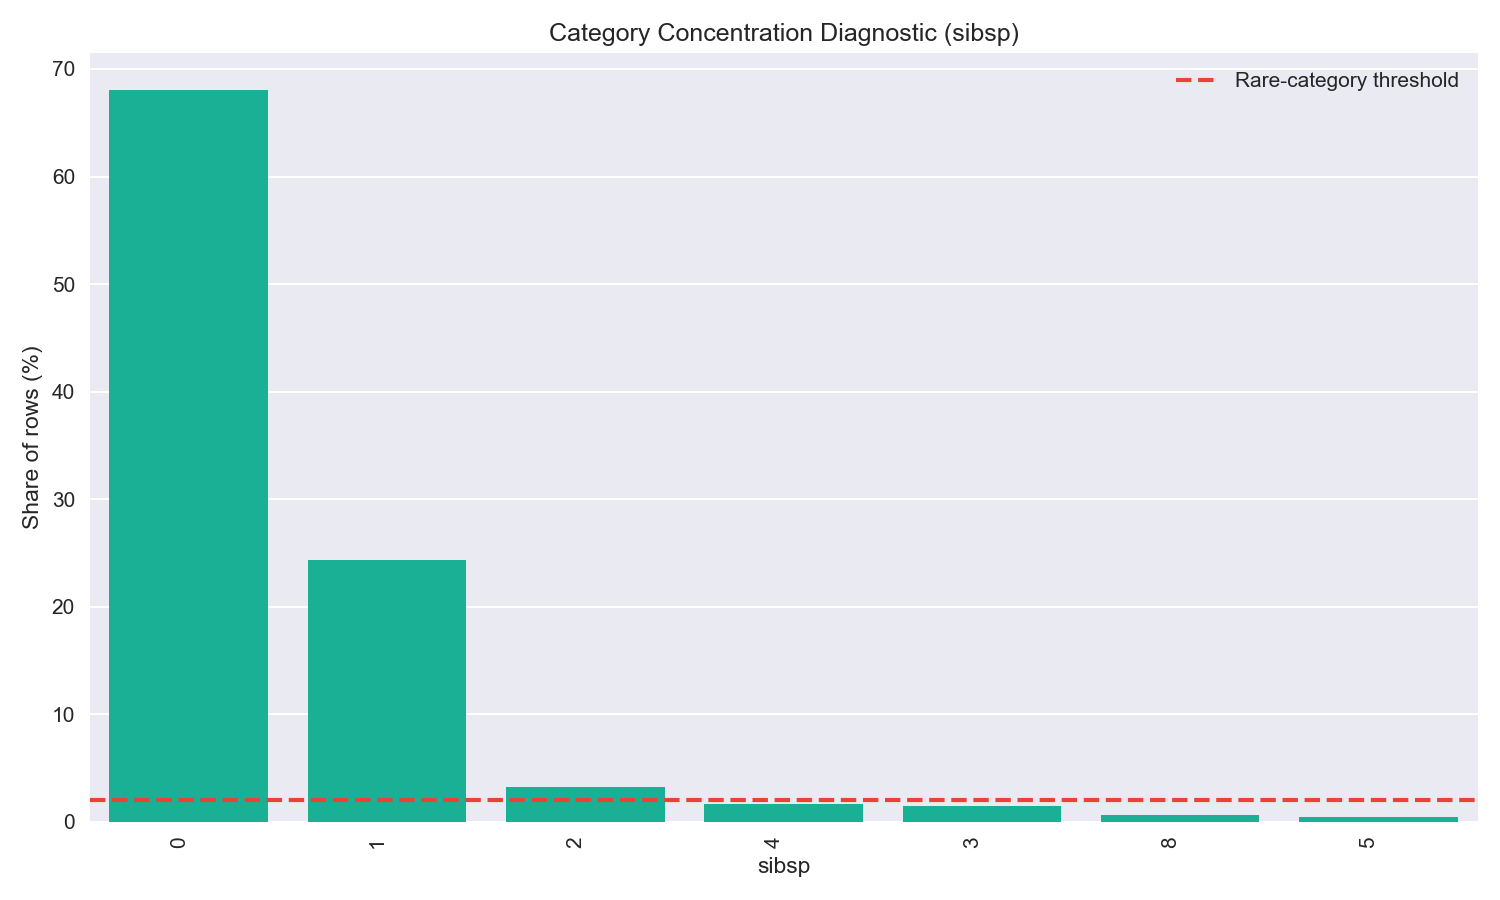
The checked fields were pclass, sex, age, sibsp, parch, and fare. No high-cardinality or near-constant feature warning was recorded; duplicate rows, missingness, and outlier signals were preserved for review.
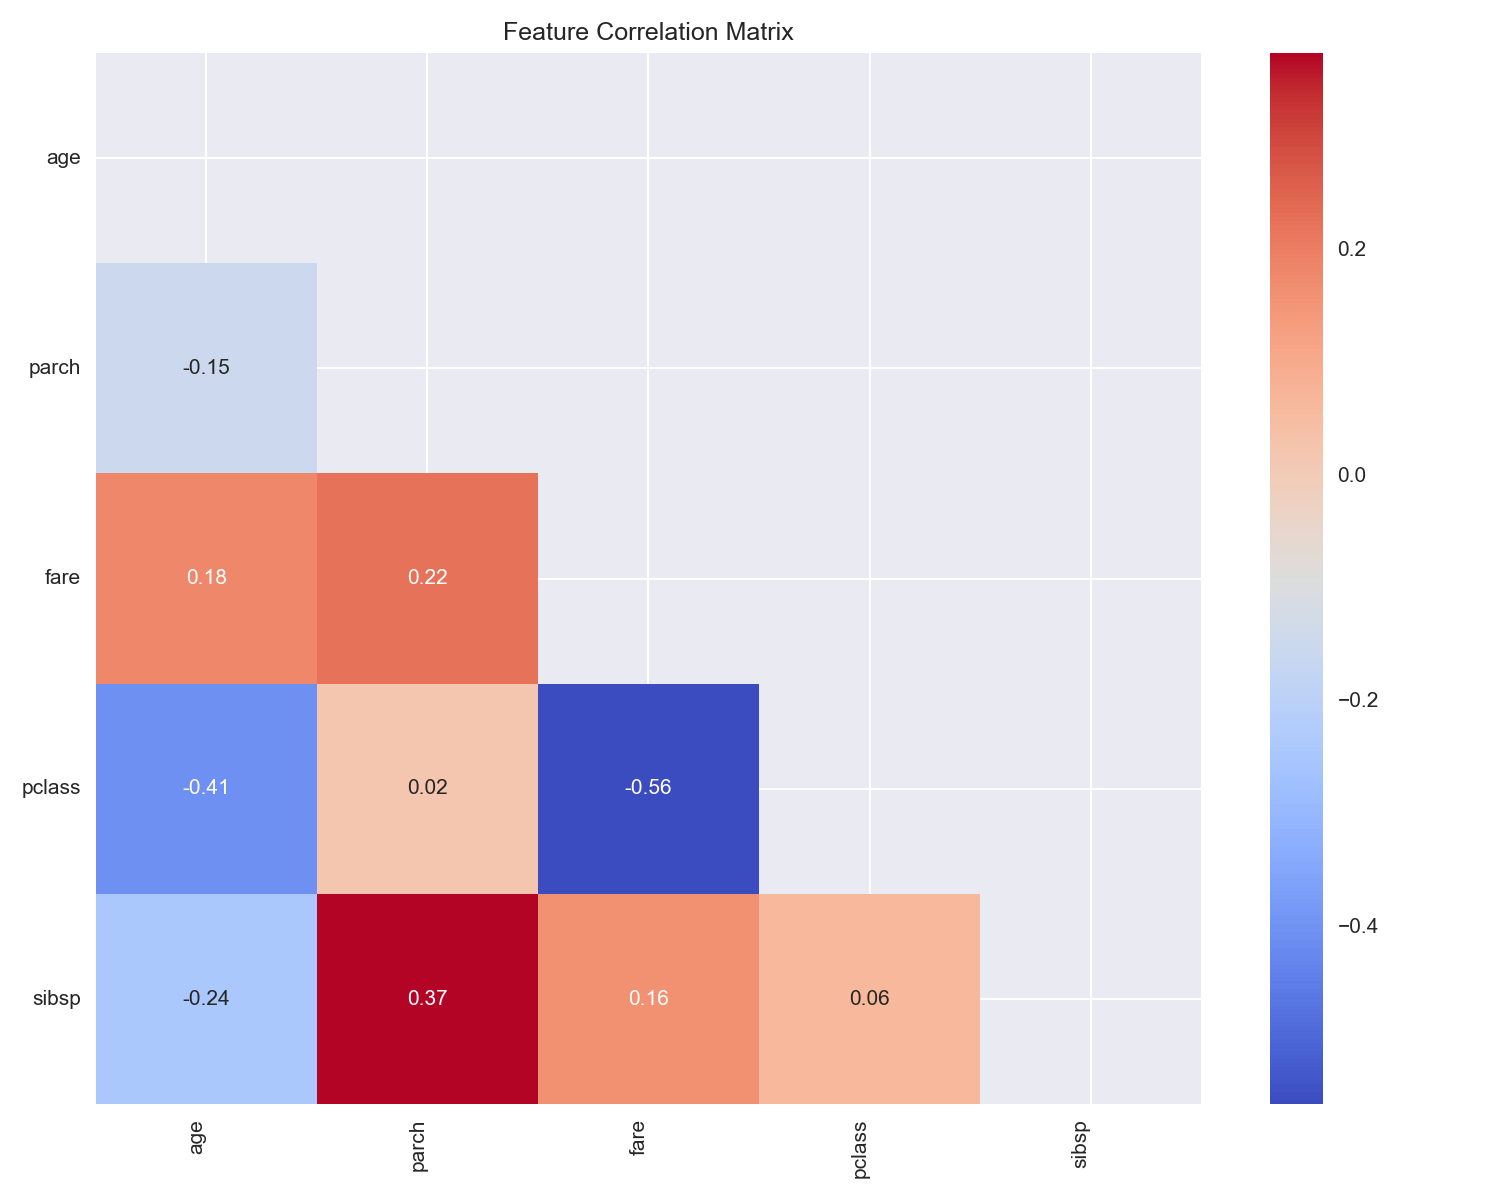
The readiness profile kept the expected checks visible: stratified holdout, class-balance review, expected metrics, and expected plots such as target distribution, feature distributions, correlation heatmap, confusion matrix, ROC curve, and precision-recall curve.
The EDA stage recommended CatBoost, LightGBM, and RandomForest as strong starting points for this classification workflow.
The run kept a class-imbalance caution visible: inspect minority-class recall and avoid treating headline performance as production-ready without review.
The diagnostic bundle was marked complete for the classification workflow, with 21 saved plots available across EDA, model diagnostics, threshold review, and SHAP explainability.
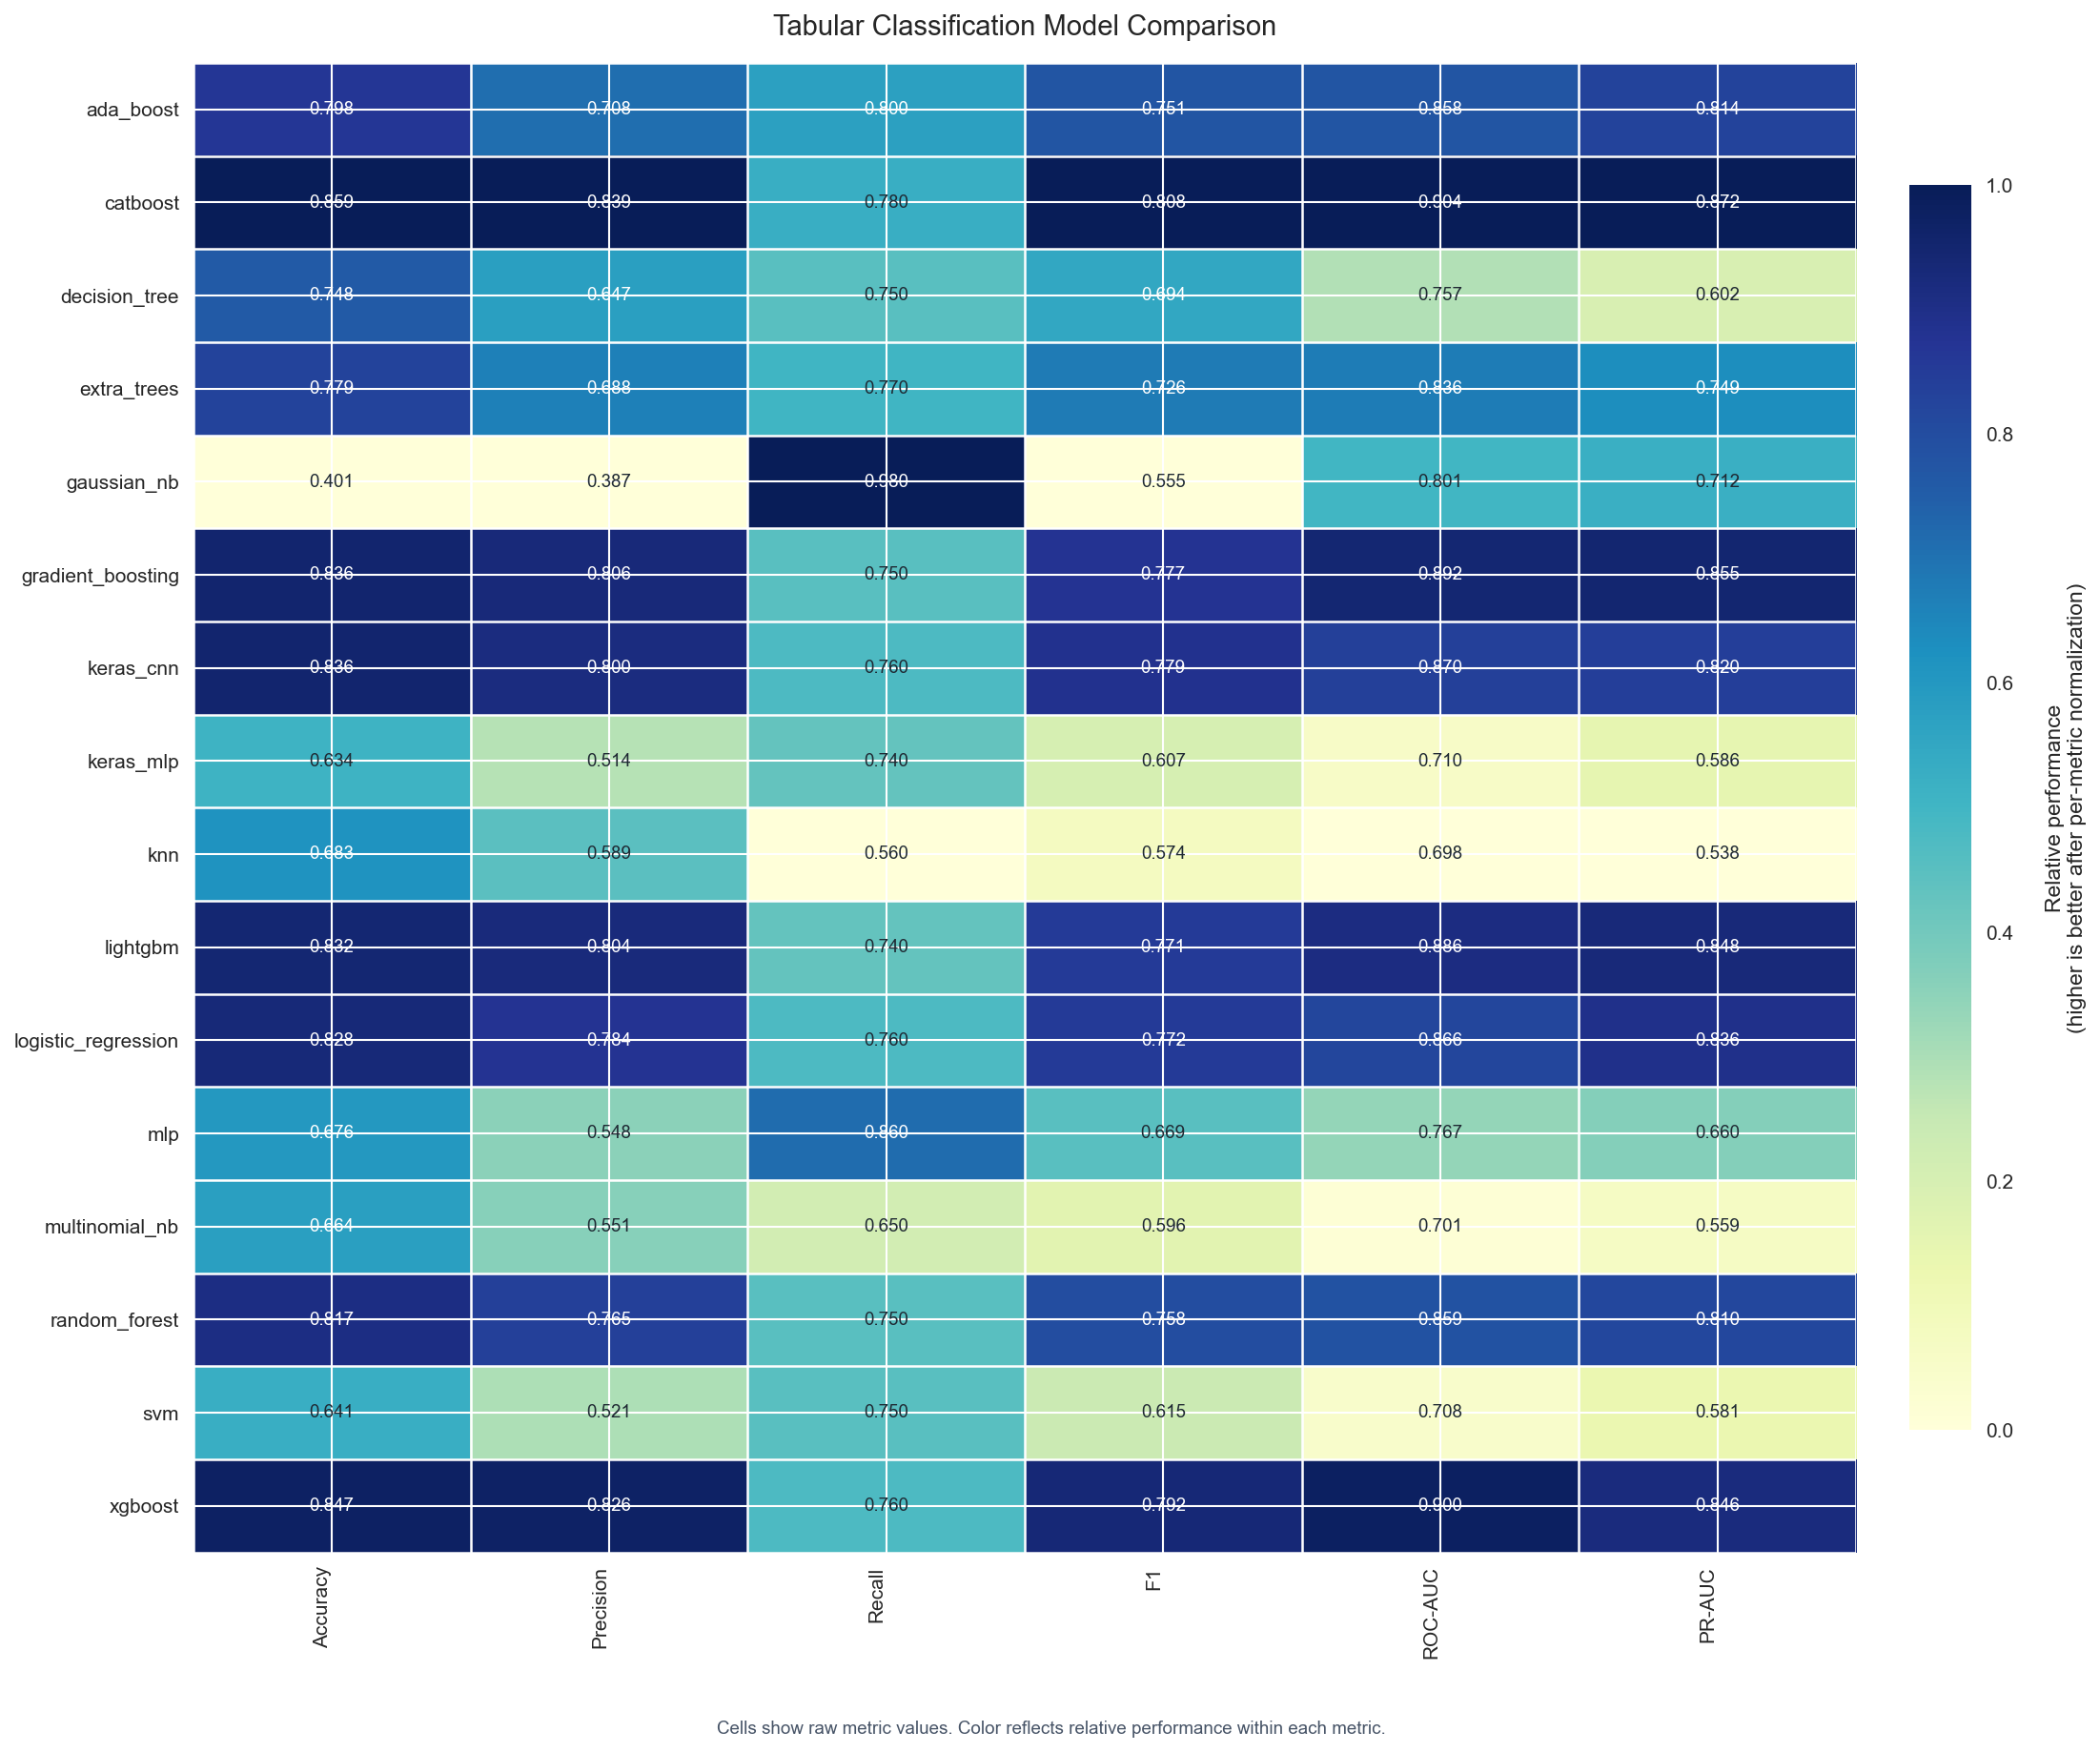
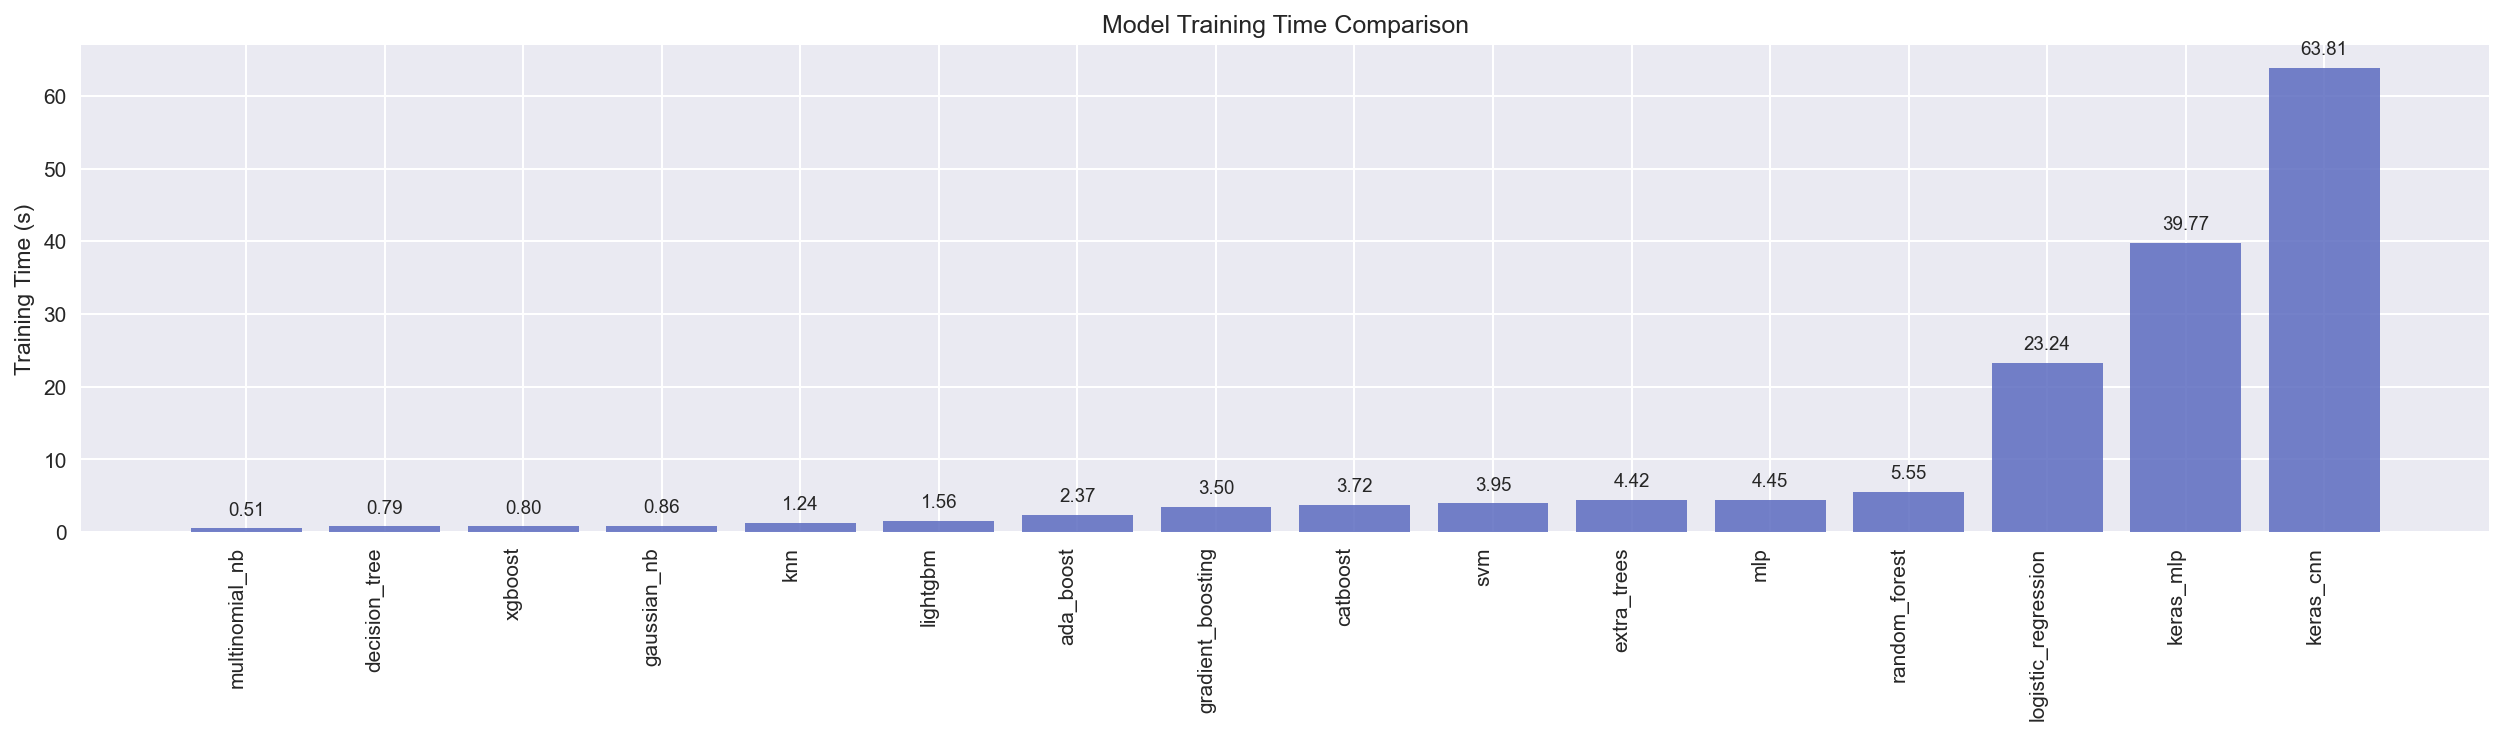
CatBoost was chosen using F1, ROC AUC, and PR AUC. Accuracy is still reported below, but it is supporting context rather than the selection rule.
| Model | Accuracy | F1 | ROC AUC | PR AUC |
|---|---|---|---|---|
| CatBoost | 85.88% | 80.83% | 90.39% | 87.24% |
| XGBoost | 84.73% | 79.17% | 89.96% | 84.62% |
| Keras CNN | 83.59% | 77.95% | 87.01% | 81.98% |
| Gradient Boosting | 83.59% | 77.72% | 89.22% | 85.46% |
| LightGBM | 83.21% | 77.08% | 88.57% | 84.84% |
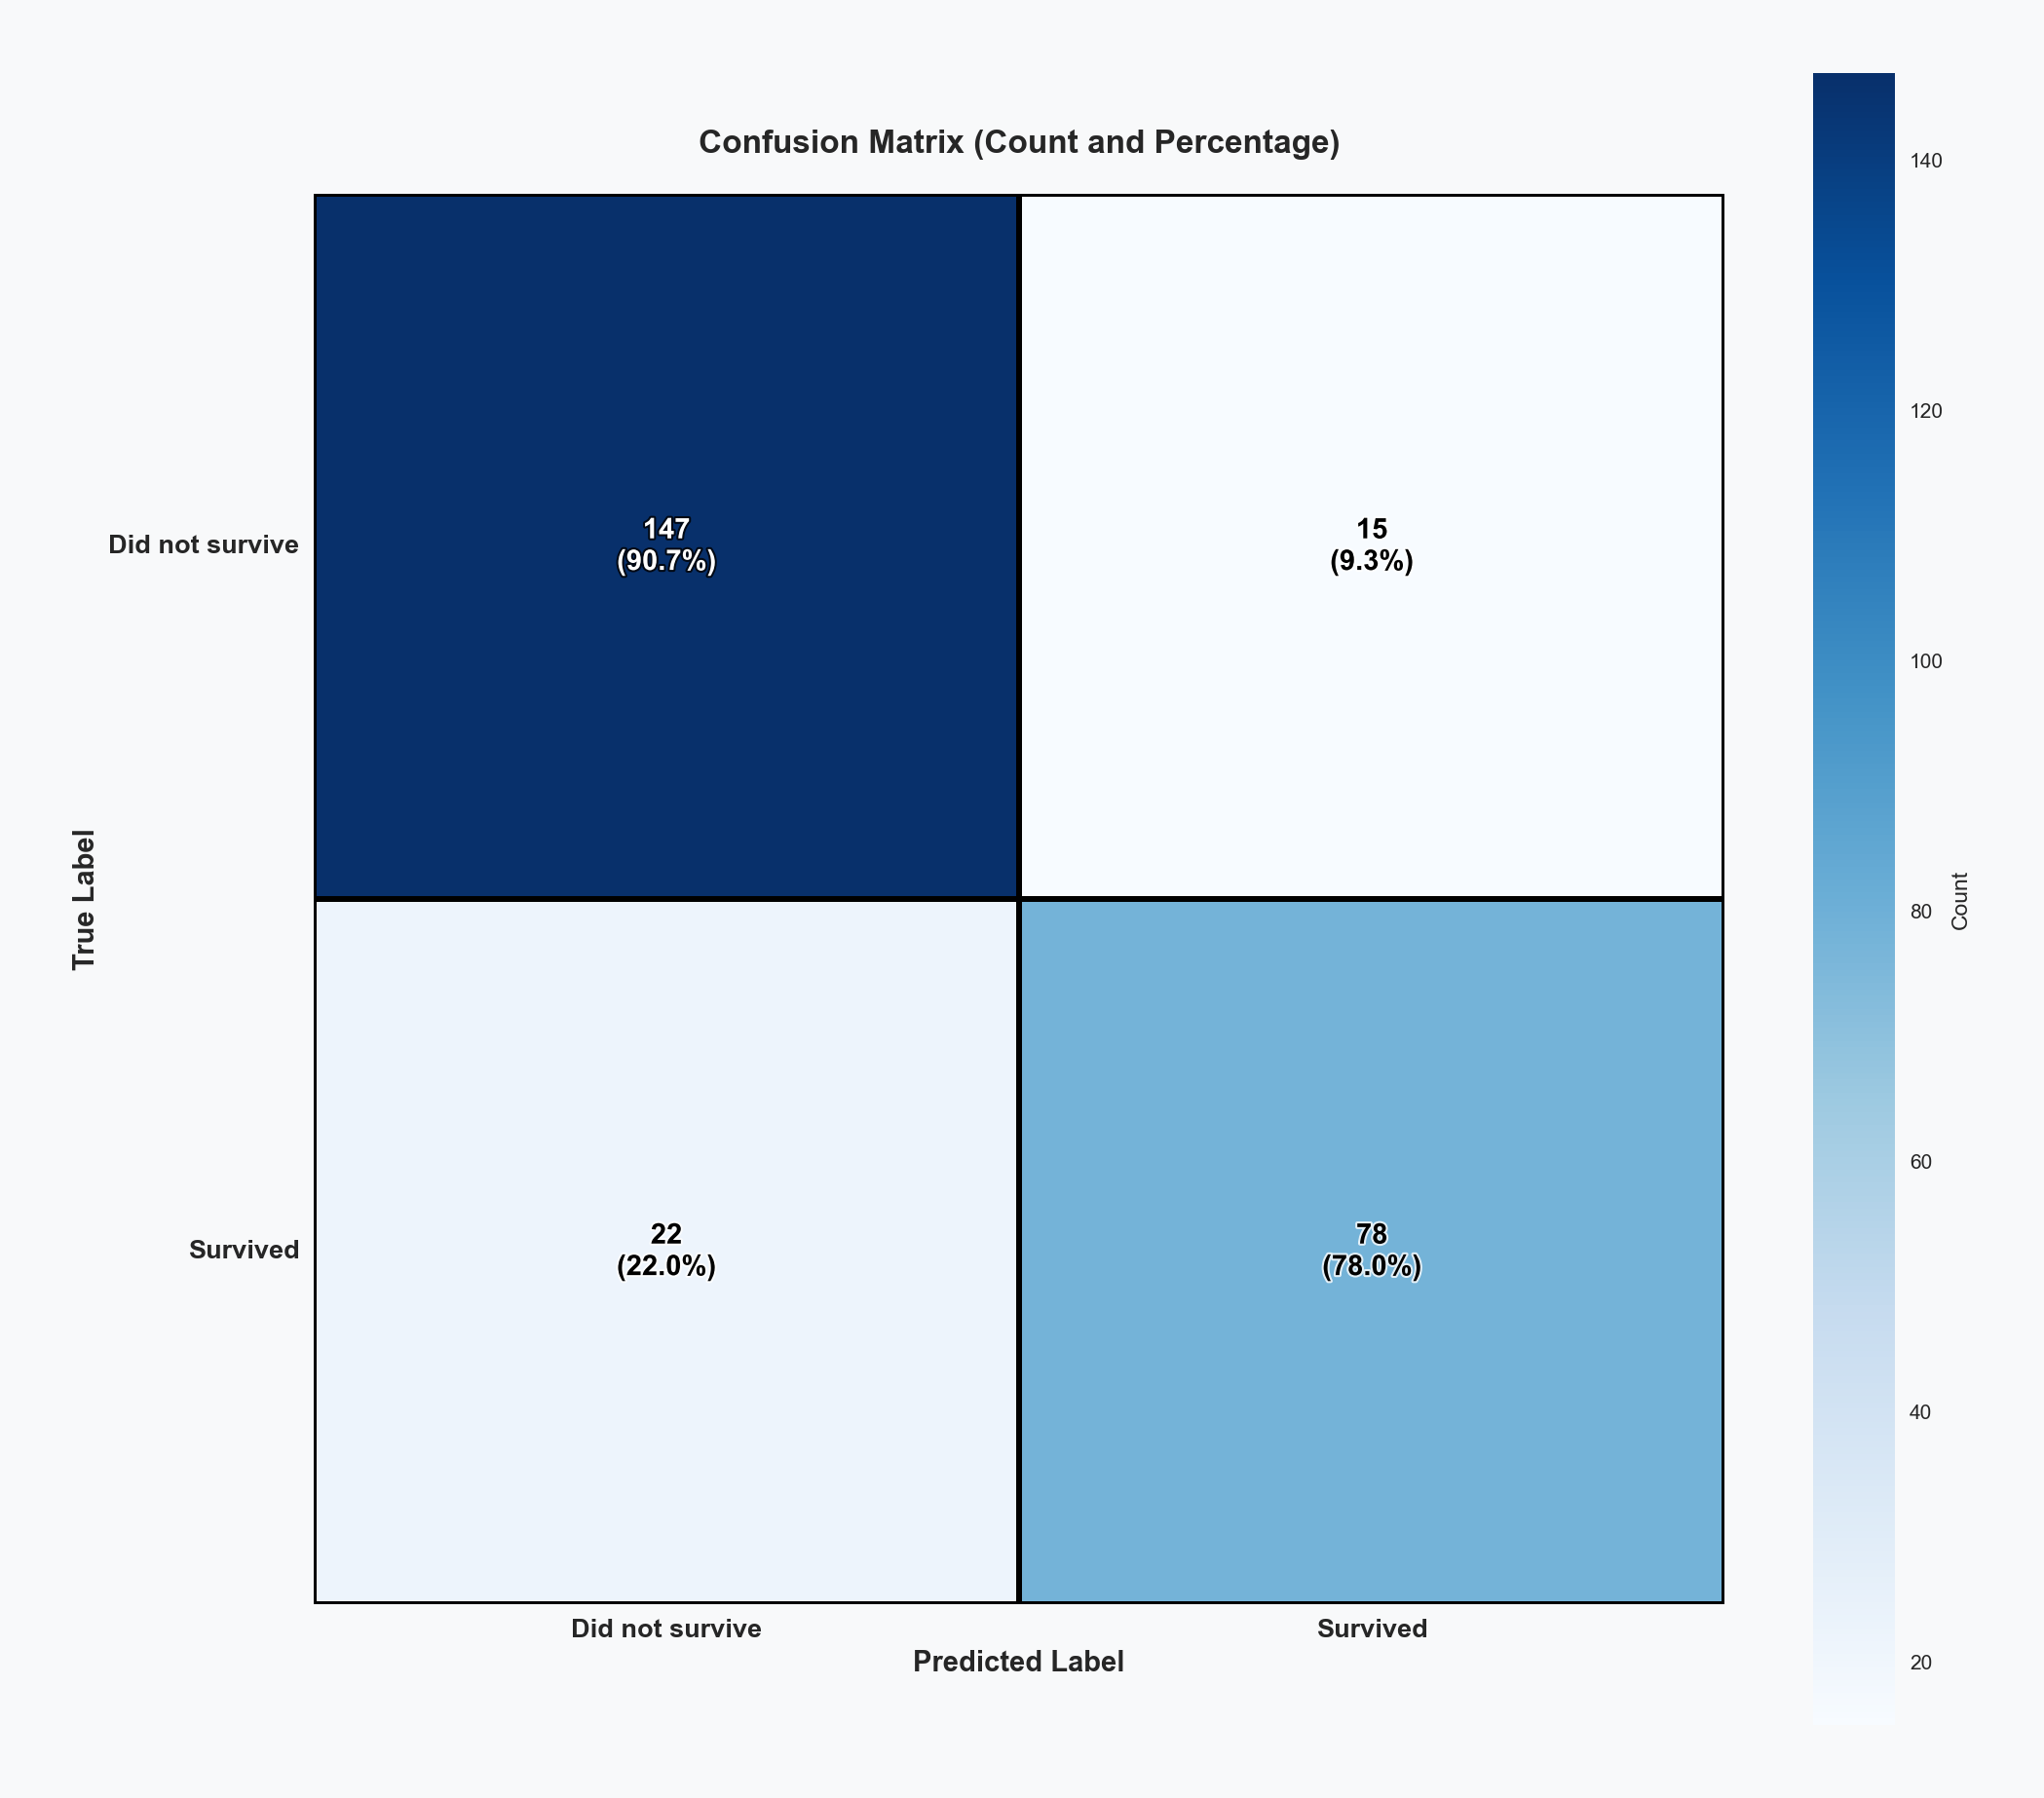
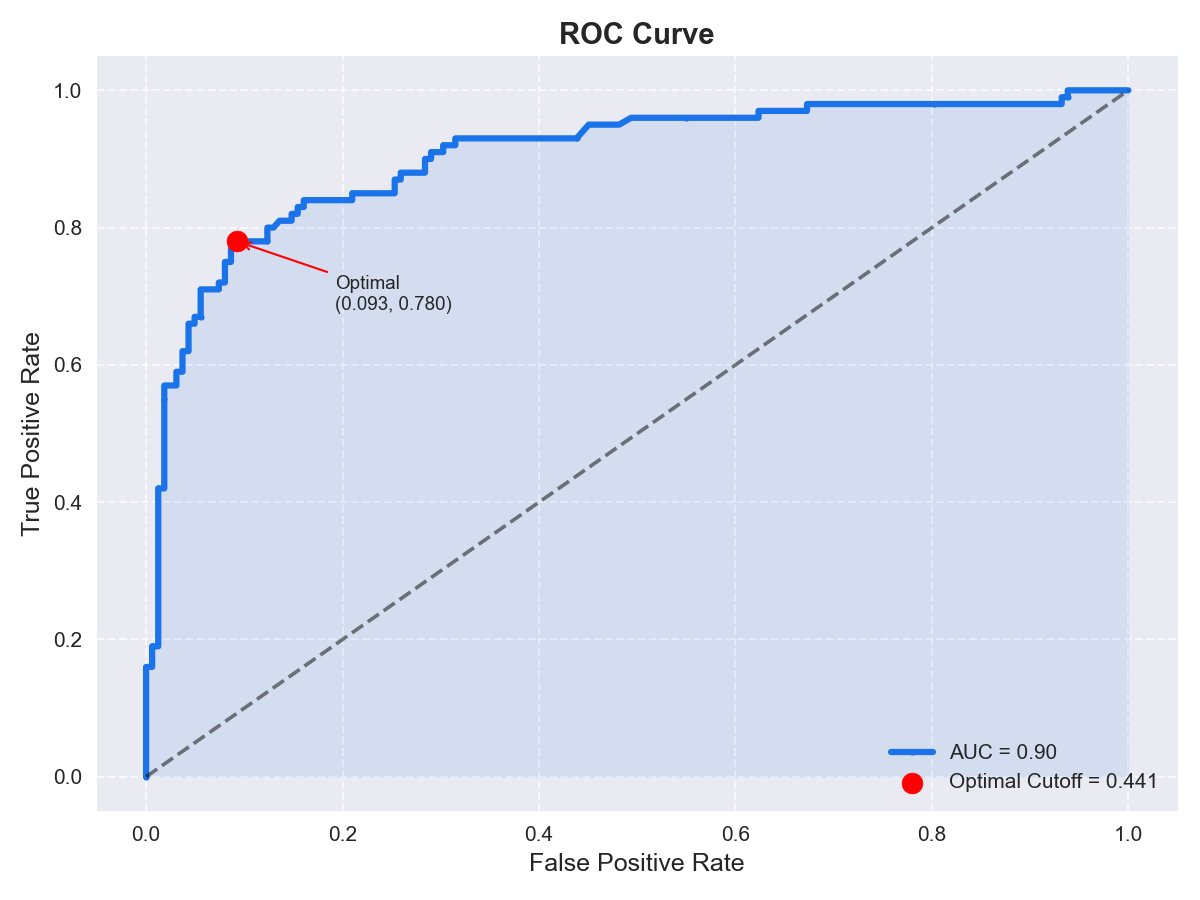
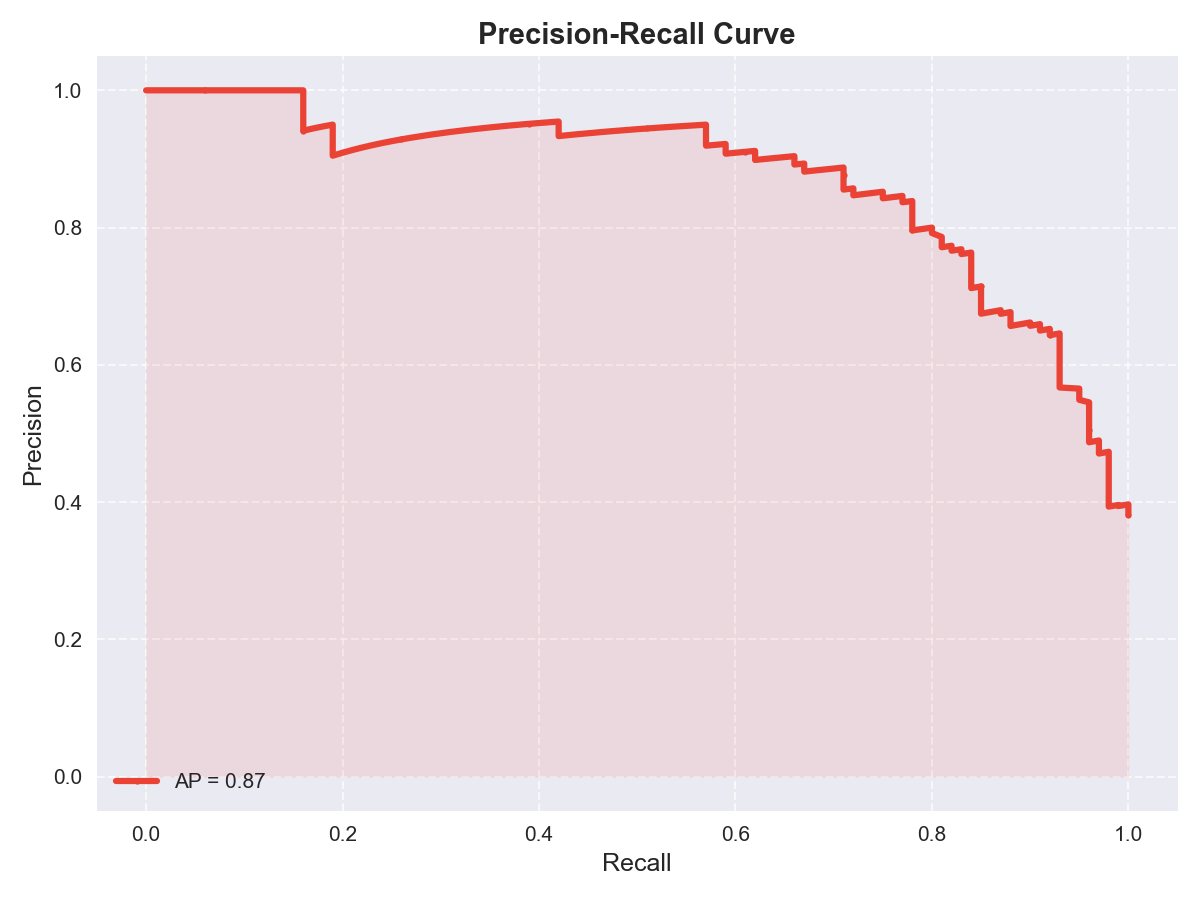
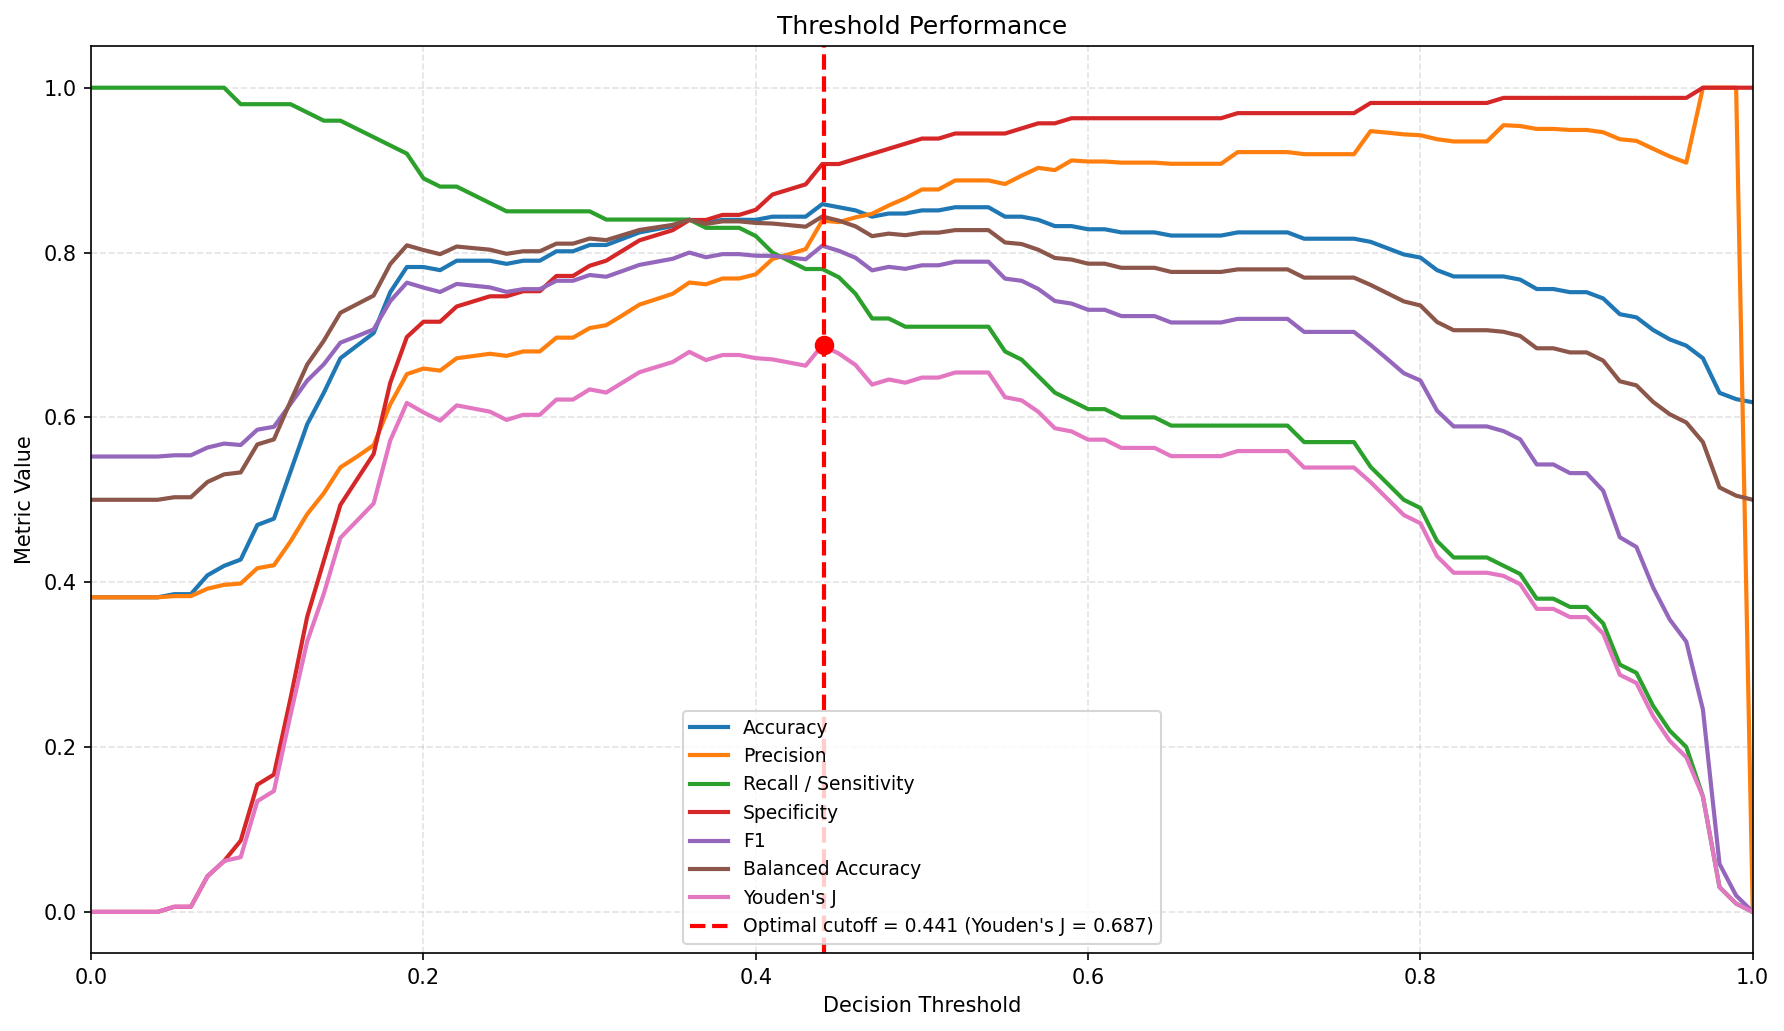
The performance plots show how the selected CatBoost model behaved on the held-out test set. The threshold plot shows the tradeoff between sensitivity, specificity, precision, recall, and related metrics as the classification cutoff changes.
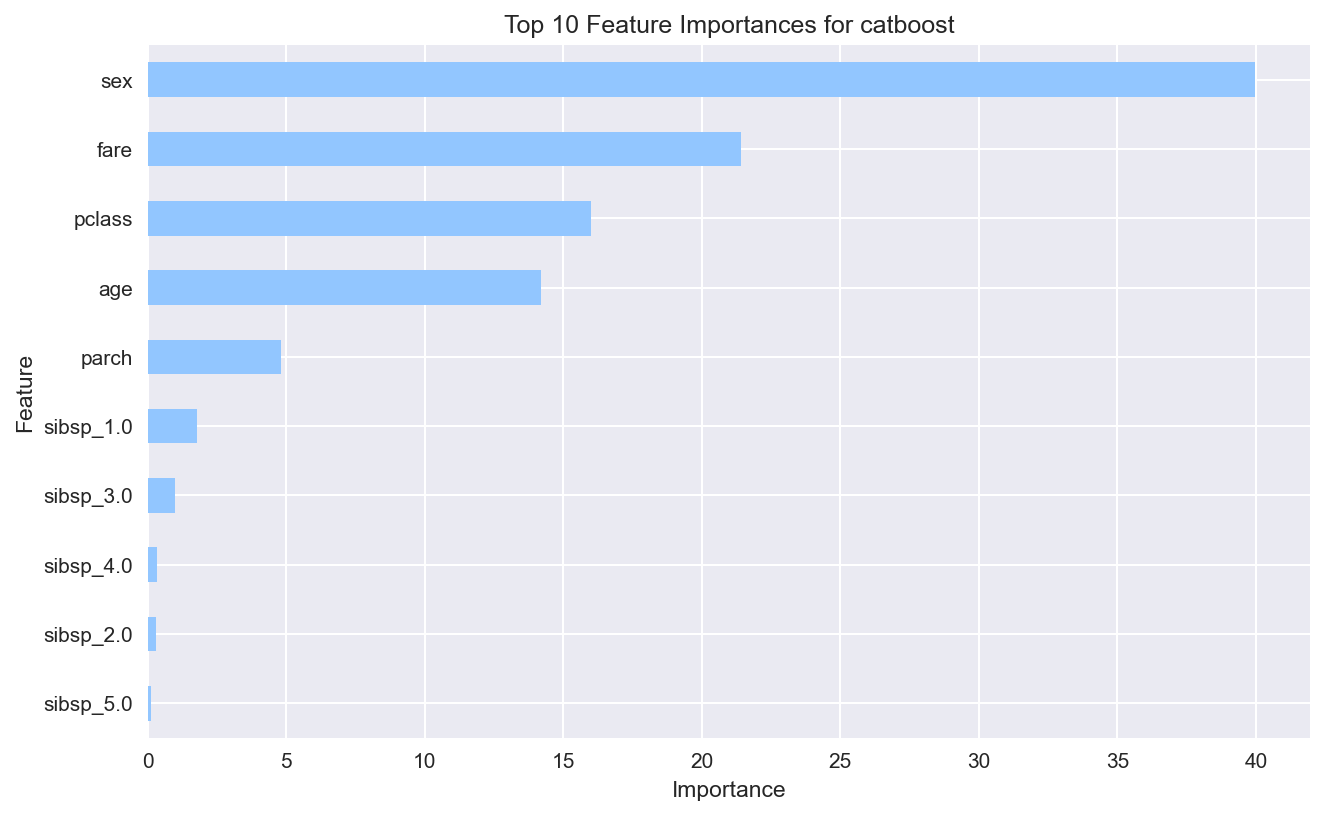
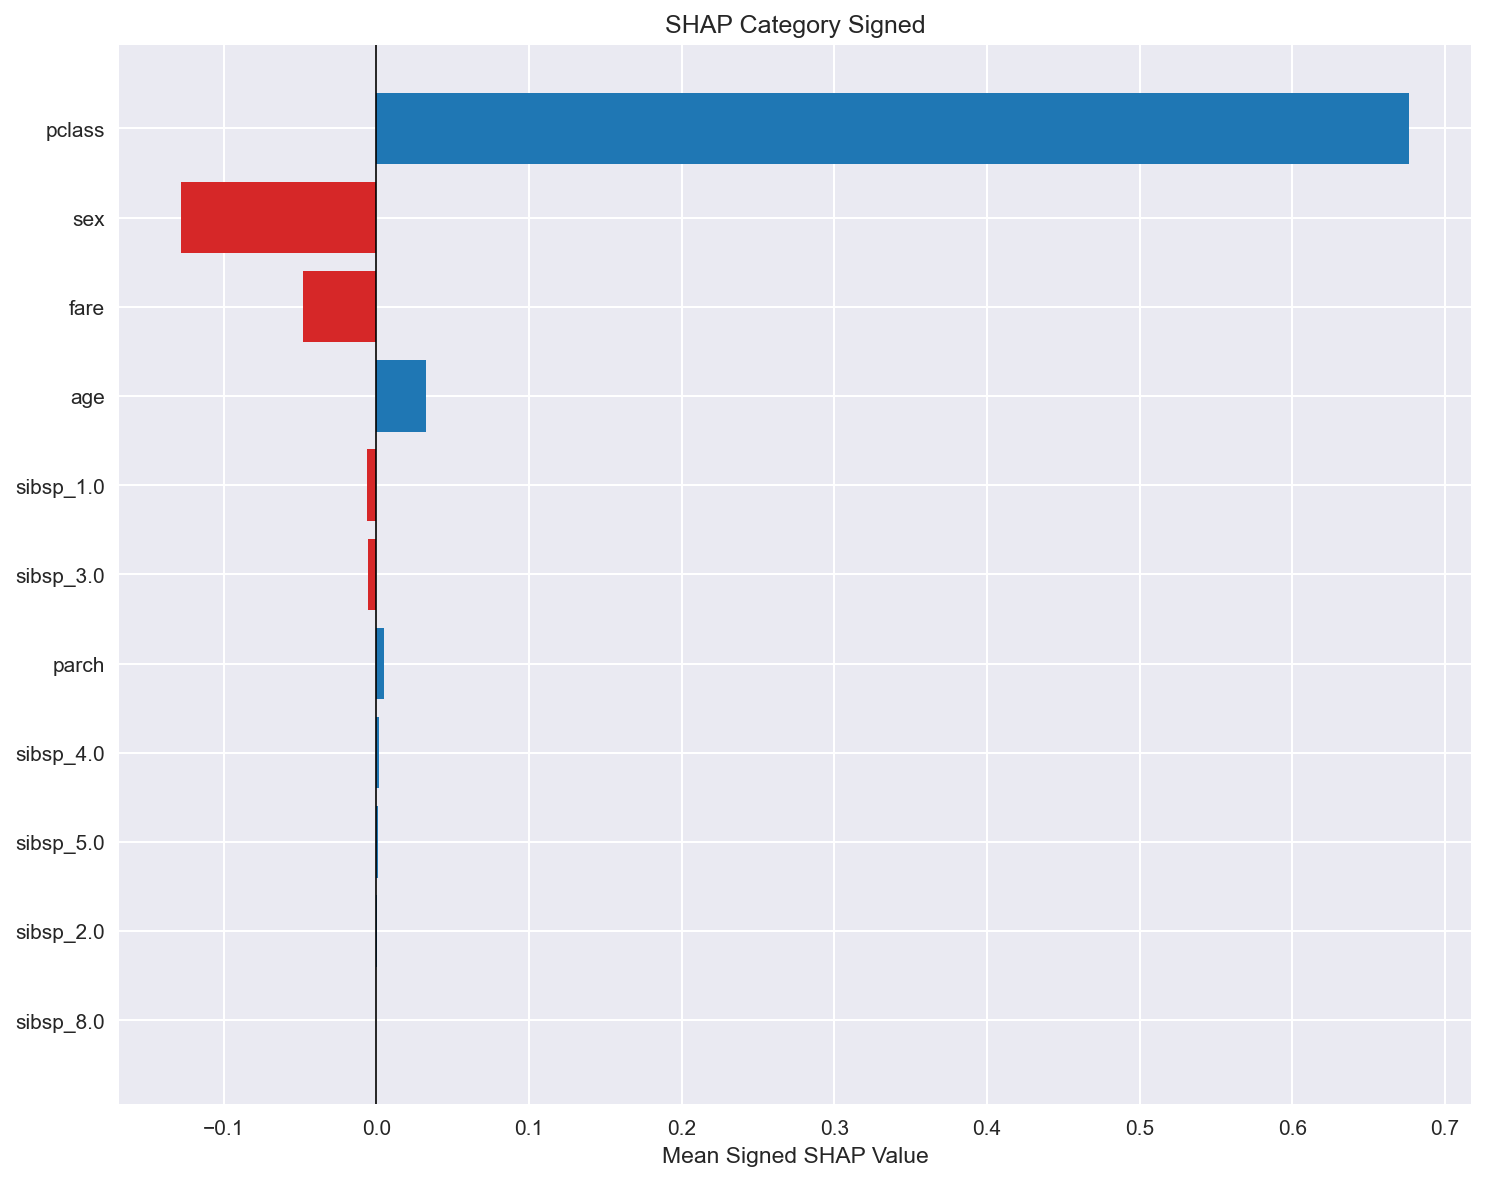
39.96% feature-importance share in the saved global ranking.
21.43% feature-importance share in the saved global ranking.
16.01% feature-importance share after grouping class indicators.
14.21% feature-importance share in the saved global ranking.
The example shows the run results. In the live AutoML platform, a completed job also has a model review panel so a reviewer can inspect the fitted model, leave notes, and record the decision.
The review panel checks job state, model result rows, the selected model, selection metrics, dataset readiness, saved files, and billing evidence.
Runs can be left as draft, moved into review, approved, marked as needing changes, or rejected. That keeps approval separate from raw training success.
Notes and history stay with the job, so later users can see why a fitted model was accepted, held back, or sent for changes.
No approval decision is invented for this public excerpt. The page shows the saved details that a reviewer would use.
This completed AutoML run compared 16 classification models on a Titanic survival dataset with 1,047 training records and 262 test records. CatBoost was selected on the strength of its F1, ROC AUC, and PR AUC evidence: 80.83% F1, 90.39% ROC AUC, and 87.24% PR AUC. Its 85.88% accuracy is reported as supporting context.
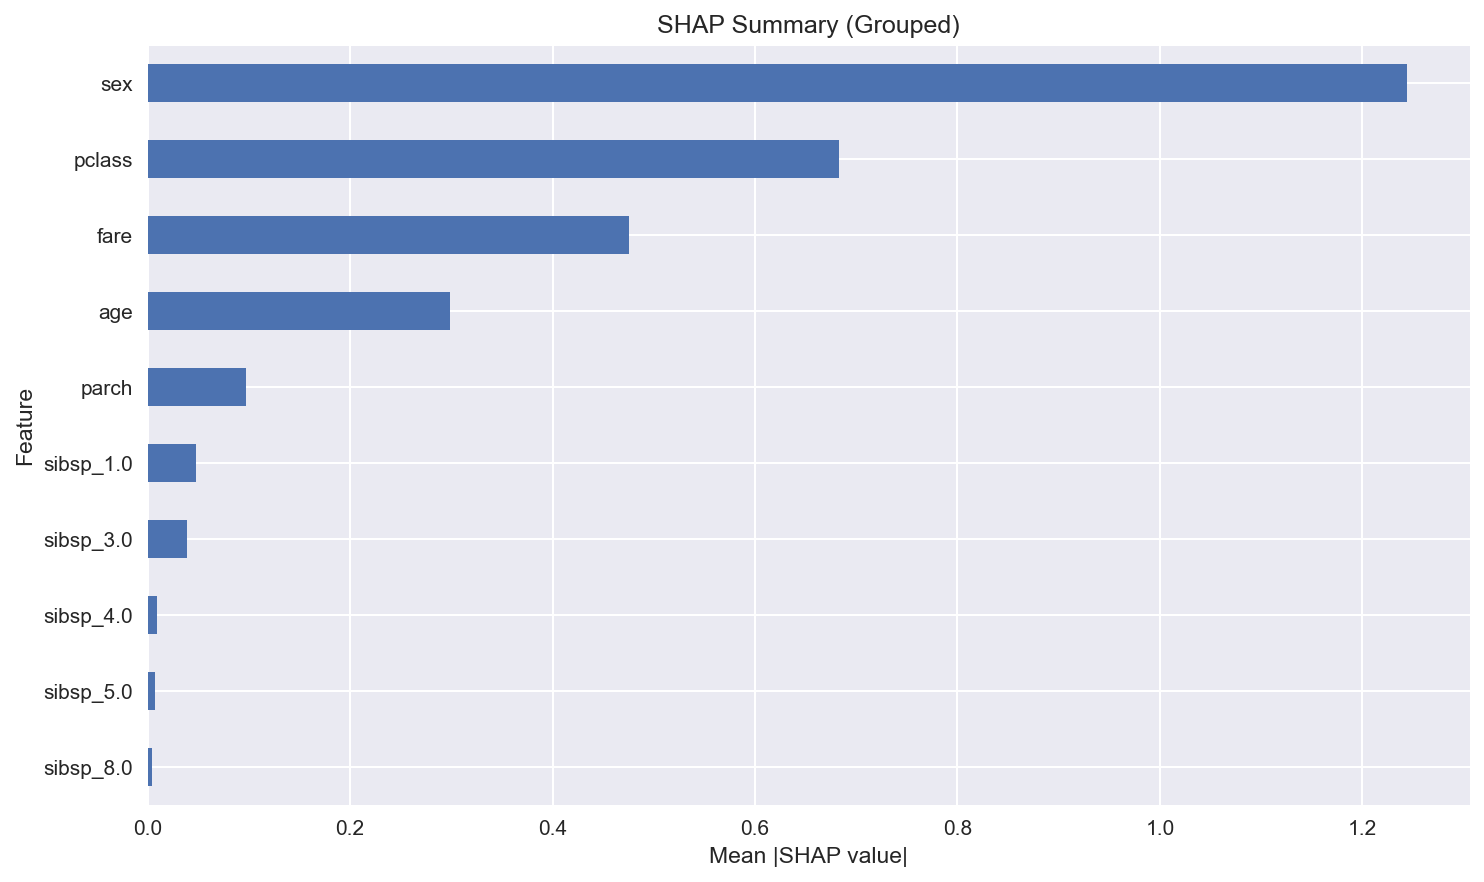
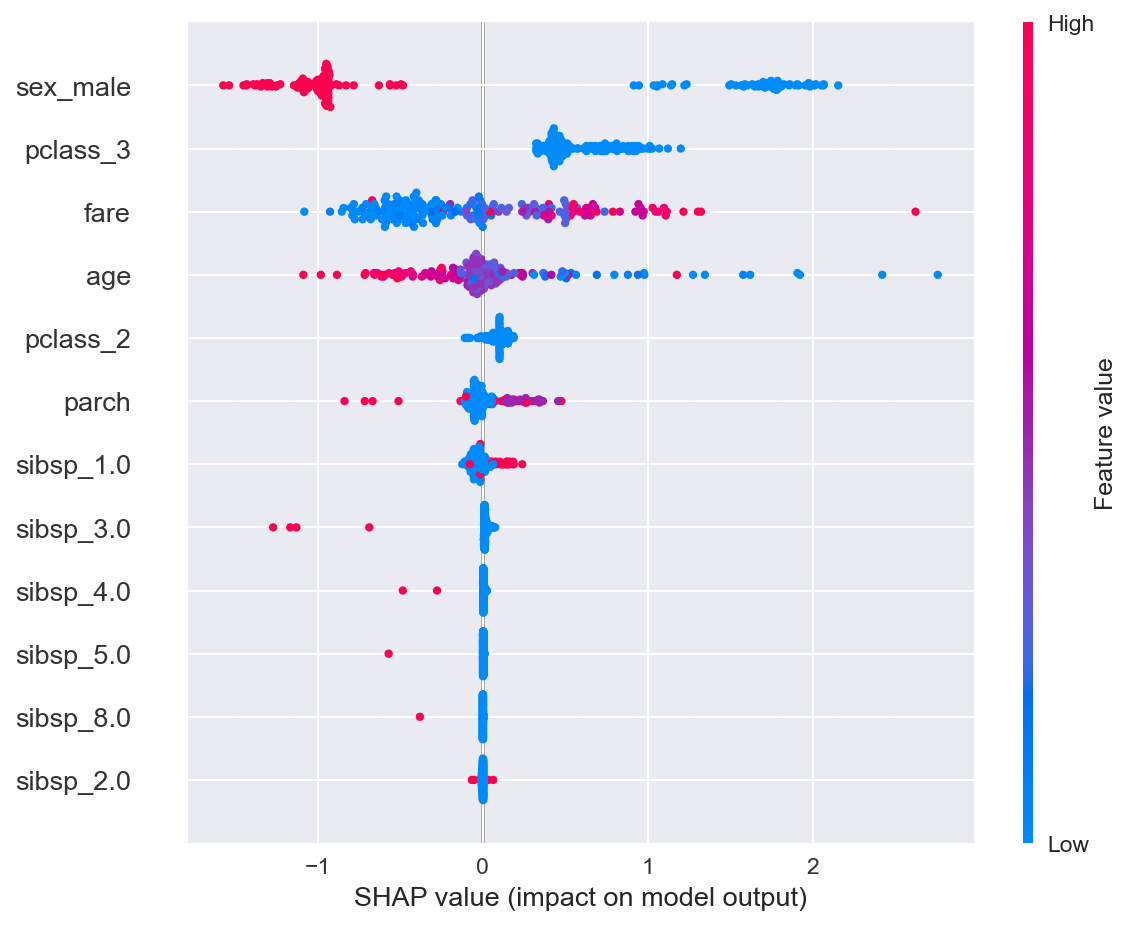
SHAP explainability completed successfully. The strongest descriptive drivers were sex, fare, passenger class, age, and parch. These signals help reviewers understand model behavior, but they should not be read as causal claims.
Short summary for the run outcome, selected model, and practical interpretation.
Manuscript-style report with methods, model comparison, confidence intervals, explainability tables, limitations, references, and figures.
Compact reproducibility notes covering the job id, service type, dataset fingerprint, selected models, split plan, and explainability status.
The full report package is long, so this section keeps only the parts a reviewer is most likely to scan first.
In short: the best model was CatBoost; the target outcome was survival; the leading features were sex, fare, passenger class, age, and parch.
This is the short summary a manager or reviewer would scan first.
In short: CatBoost was the strongest observed model in the saved package, with 0.808 F1, 0.904 ROC AUC, and 0.872 PR AUC.
Use this for technical review, not as a causal claim.
In short: the job used the Titanic CSV, a balanced training preset, 16 selected models, a 0.2 test split, and SHAP explainability.
The dataset fingerprint starts with c1b78e7b57a3.
The full manuscript includes availability statements, references, figures, and long tables. Those are better kept in the AutoML workspace or manifest package, where reviewers can open them when needed.
Open manifest →The updated job includes more than the visible charts on this page. The manifest keeps those outputs grouped so a reviewer can see what exists without turning this page into a file browser.
Executive brief, manuscript HTML/Markdown, methods appendix, references, manuscript input, prompt package, metadata, and report JSON.
Service diagnostics report 21 saved plots and a complete classification diagnostic bundle for the expected plot groups, including threshold performance.
The reproducibility manifest records the dataset fingerprint, selected models, training preset, package versions, and output inventory.
The private workspace keeps model binaries, prediction outputs, encoders, preprocessing files, optimal cutoffs, and logs. The example names those artifacts without exposing private files.
The run generated reports, prediction outputs, plots, SHAP files, model files, preprocessing files, diagnostics, logs, and metadata. This page shows the summary; the complete workspace will live inside the AutoML platform.